So here’s the thing: I’m getting into this S4 and I want to do something more hardcore and, for that, I’ll use AskMrRobot to guide me in my item upgrades. For that I need to test as many combinations of items, rotations, etc. as possible, and I’m willing to put some effort into that.
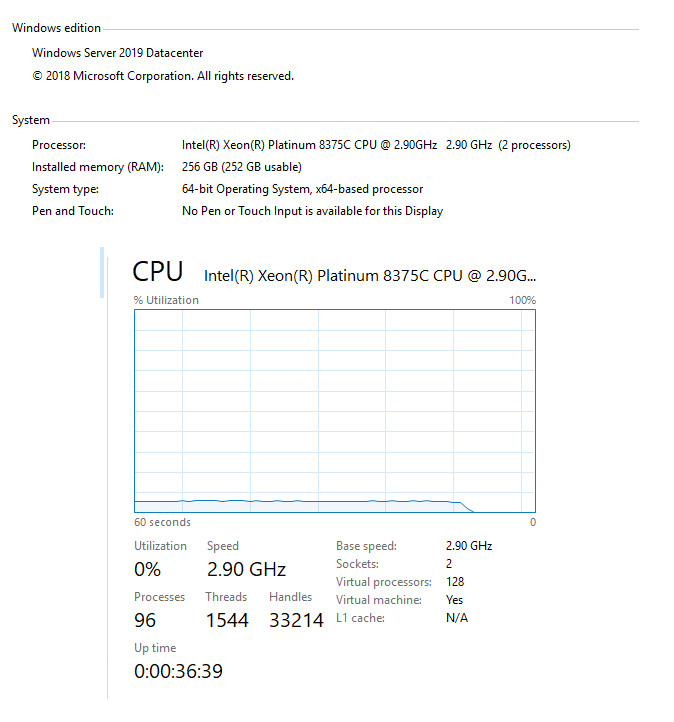
It happen that I have some credits in a certain server hosting company and I created a Windows Server machine there, with 64 processing cores and 256Gb of memory to test what the simulation would look like on it, and not on my personal computer ( which has 8 cores and 16GB).
I configured the JSON to use all possible threads (value 1.0) but the simclient is not using more than 10% of its total processing power.
The SYM Client says there’s only 64 processors available: 8 worker(s) started with 8 threads each
The same setting on my local machine makes my CPU usage jump up to 90%.
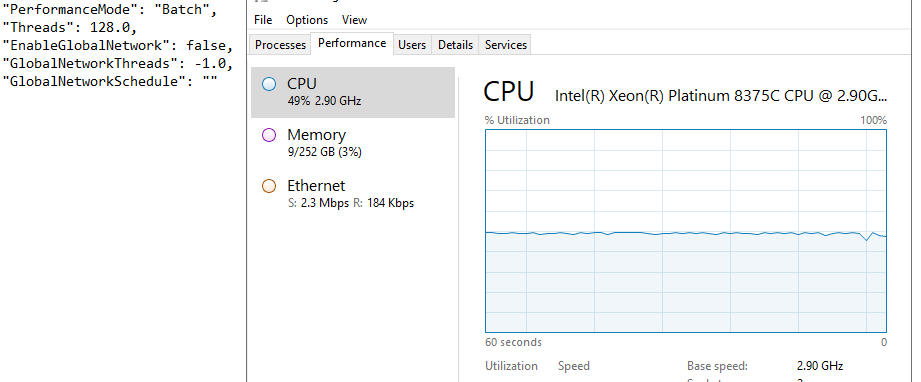
Even the JSON is configured to 128.0 threads it seems to not use the entire server potential.
Is there a specific configuration for me to extract as much of the potential of this server as possible or is this some limitation of the application?
Here my M+ SIM from the test re-run e38d422ea0ec42cea55276664d261290 - Report (askmrrobot.com)
If you check out the sim client manual (Simulator Client Manual), look at the section at the end titled “Garbage Collection”. Turn that setting on and it usually makes machines with high thread counts run much faster. Let me know if that makes a difference for you.
Okay… I’ve activated the garbage collector and this happens:

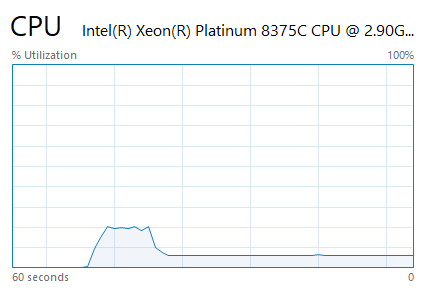
20% peak for some seconds then falls to under 10% again when SIM’ing 37 combinations ( re-run 2b1a17eb41e6472cb71923bb0d679b1c - Report (askmrrobot.com) )
It goes up to 40% when re-SIM’ing 529, falling to under 10% in the very end of it re-run f6e59d4fdcce467e82d0c856c03d7dec - Report (askmrrobot.com)
37 combinations won’t be enough to saturate that many cores. 529 isn’t that many either, though it should get a little higher than that. Try a couple thousand and see what happens.
Running now an 19k setup’s build:

Try manually increasing the number of threads to 2x the number of cores, set it to 128.
Changed the config.
Put it to SIM 728.6k ( d618f42be6054230a1f8e5b1325678e6 )
Still capping on 50% CPU usage.
I think this is an issue I saw once before. If you have a dual cpu, windows creates multiple CPU groups, and .NET core (what we use to run the client) has difficulty using all the cpu groups. They’re working on a configuration setting for it, but it isn’t available yet. I believe you can fix the problem by setting these two environment variables on your machine:
set complus_GCCpuGroup=1
set COMPlus_Thread_UseAllCpuGroups=1
Note: you have to stop the client and restart it for it to see the environment variable changes.
1 Like
Did it on Environment Variables and it worked! Now capping between 85%~95% CPU usage
Something very weird happened: I was running since yesterday the simulation d618f42be6054230a1f8e5b1325678e6 on this remote server.
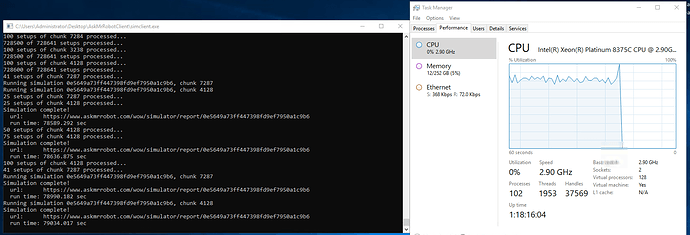
Some minutes ago I’ve accessed it throug the RDP connection (to see how the processor/RAM graphs was going) and when I did it the SIMclient just stop processing the simulation: I’ve seen the graph go to it’s 90% average to <1% average since the server screen loads.
Now seems that the simulation isn’t happening anymore, even if I restart the simclient. There is nothing on the cache folder files nor errorson the log folder files.
@yellowfive look at this:
23 hours ago as I reported on my last post here I’ve restarted the simulation run as the server seems to stop to process right after I’ve accessed it trough RDP (Windows Terminal).
Today, as I could see, my simulation (new ID: d618f42be6054230a1f8e5b1325678e6 ) stuck again at 82%. Then I enter on the server and this happens: the processor stopped again.
But, for some reason, my old simulation (ID 0e5649a73ff447398fd9ef7950a1c9b6) ended successfully, even it not started when I restart the simclient yesterday.
— EDIT
Another quick question about this: I need to download the entire CSV but it has only “hashed” item IDs. How can I search by it on AMR site? For instance, this neck ID: 109966b244b1005b1052b1208b1251b2069
It’s on my list to make it a bit easier for people to read the CSV files. The item ID is the item ID as seen in-game and on any database site like wowhead, followed by any number of bonus IDs preceded with the letter “b” as a separator. The bonus IDs show up at the very bottom of the item tooltips on our website in small text, and are specific to AMR (the game’s bonus IDs tend to be redundant or ambiguous at times, so we map them to a more streamlined set for use on our site). The bonus IDs do things like modify item level, add titles like “Heroic”, add sockets, etc.
It’s hard for me to say why your simulation is stalling… it could be specific to your simulation, maybe there’s a combination that the simulator is having trouble with that is running a lot slower than it should. It could be something with your server… that would be unusual though not impossible.
Around patches like this, I am usually running batches with anywhere from 1000 to 200,000 combinations, and I am queuing up thousands of batches at a time… so I’m pretty sure that the batch simulations in general are working.
It’s possible that they could be hitching when we do server updates… we do very frequent updates around patches like this. I have one more planned for probably later tonight or tomorrow. In theory updates shouldn’t cause a problem for your simulations… but it’s possible there’s something not working as intended.
1 Like
