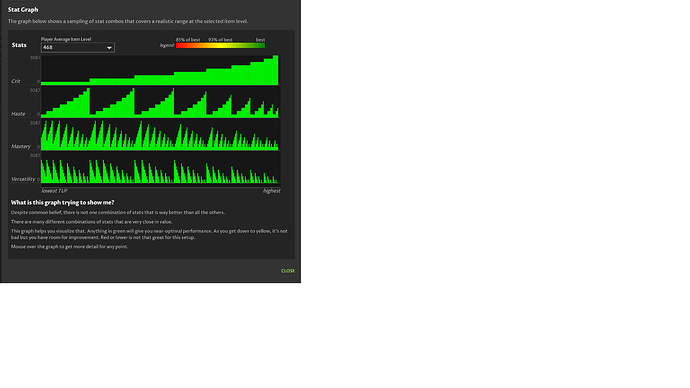
Hey everyone, recently when looking at the optimal stat graph distribution it used to showed varied stat distributions and how good they were. Currently it’s just showing a generic looking stepped graph that doesn’t make much sense.
Was there a recent update for this or am I seeing something wrong?
